Designing a Tool for Profiling Core ML Model Times
To effectively profile Core ML models, we've developed a dedicated tool called CoreMLProfiler. This tool provides insights into model compilation, loading, and prediction times, as well as detailed information about each operation within the model. Let's explore the key components and functionality of this tool.
Core Functionality
The CoreMLProfiler tool is built around the CoreMLProcessor class, which handles the main profiling logic. Here are the key features and components:
1. Model Loading and Compilation
The tool can handle both .mlpackage and .mlmodelc files. If an .mlpackage file is provided, it first compiles the model:
private func compileModel(at packageURL: URL) async throws -> (URL, [Double]) {
    var compileTimes: [Double] = []
    for _ in 1...10 {
        let compileStartTime = DispatchTime.now()
        let tempCompiledModelURL = try await MLModel.compileModel(at: packageURL)
        let compileEndTime = DispatchTime.now()
        let compileNanoTime = compileEndTime.uptimeNanoseconds - compileStartTime.uptimeNanoseconds
        let compileTimeInterval = Double(compileNanoTime) / 1_000_000
        compileTimes.append(compileTimeInterval)
    }
    // ... (code to return results)
}
2. Model Loading
The tool loads the compiled model multiple times to get an average loading time:
private func loadModel(at compiledModelURL: URL, configuration: MLModelConfiguration) async throws -> (MLModel, [Double]) {
    var loadTimes: [Double] = []
    for _ in 1...10 {
        let loadStartTime = DispatchTime.now()
        let tempModel = try await MLModel.load(contentsOf: compiledModelURL, configuration: configuration)
        let loadEndTime = DispatchTime.now()
        let loadNanoTime = loadEndTime.uptimeNanoseconds - loadStartTime.uptimeNanoseconds
        let loadTimeInterval = Double(loadNanoTime) / 1_000_000
        loadTimes.append(loadTimeInterval)
    }
    // ... (code to return results)
}
3. Dummy Input Creation
One of the most crucial and complex parts of the profiler is the createDummyInput function. This function dynamically creates appropriate dummy inputs based on the model's input requirements:
private func createDummyInput(for model: MLModel) -> MLFeatureProvider? {
    let modelDescription = model.modelDescription
    var inputDictionary = [String: MLFeatureValue]()

    for (name, description) in modelDescription.inputDescriptionsByName {
        switch description.type {
        case .multiArray:
            // Create dummy MLMultiArray
        case .image:
            // Create dummy CVPixelBuffer
        case .dictionary:
            // Create dummy dictionary
        case .sequence:
            // Create dummy sequence
        // ... (other cases)
        }
    }

    return try? MLDictionaryFeatureProvider(dictionary: inputDictionary)
}
This function handles various input types, including multi-arrays, images, dictionaries, and sequences, ensuring that the profiler can work with a wide range of Core ML models.
4. Compute Plan Analysis
The tool uses the MLComputePlan to analyze the model's structure and estimate costs for each operation:
private func getComputePlan(of modelURL: URL, configuration: MLModelConfiguration) async throws -> MLComputePlan? {
    return try await MLComputePlan.load(contentsOf: modelURL, configuration: configuration)
}

private func processModelStructure(_ modelStructure: MLModelStructure, plan: MLComputePlan, medianPredictTime: Double, fullProfile: Bool) -> [String: Any] {
    // ... (code to process model structure)
}
This analysis provides insights into the model's operations, their costs, and preferred execution devices.
This analysis uses the MLComputePlan API to analyze the model's structure and estimate costs for each operation.
5. Prediction Time Estimation
The tool estimates the execution time for each operation based on the overall prediction time and the relative cost of each operation:
private func getOperationStructure(operation: MLModelStructure.Program.Operation, plan: MLComputePlan, operationCount: inout Int, startTime: Double, endTime: Double, medianPredictTime: Double, cost: Double, fullProfile: Bool) -> [String: Any]? {
    // ... (code to estimate operation times)
}
The prediction function runs the model 10 times and calculates the median execution time:
            private func makePrediction(with input: MLFeatureProvider, model: MLModel) throws -> [Double] {
                var predictTimes: [Double] = []
                for _ in 1...10 {
                    let predictStartTime = DispatchTime.now()
                    let _ = try model.prediction(from: input)
                    let predictEndTime = DispatchTime.now()
                    let predictNanoTime = predictEndTime.uptimeNanoseconds - startTime.uptimeNanoseconds
                    let predictTimeInterval = Double(predictNanoTime) / 1_000_000
                    predictTimes.append(predictTimeInterval)
                }
                predictTimes.sort()
                return predictTimes
            }
The estimated time for each operation is then calculated by multiplying the median prediction time by the cost of each operation reported in step 4.
6. ANE Compatibility Analysis
The tool analyzes the analytics.mil file to determine why certain operations are not compatible with the Apple Neural Engine (ANE). This feature was inspired by the work of @FL33TW00D, whom we thank for the interesting discovery of the analytics.mil file.
private func findLatestAnalyticsFile(in directory: String) -> URL? {
    // ... (code to find the analytics.mil file)
}

private func decodeAnalyticsFile(at url: URL) -> [OperationDetails] {
    // ... (code to decode the analytics file)
}
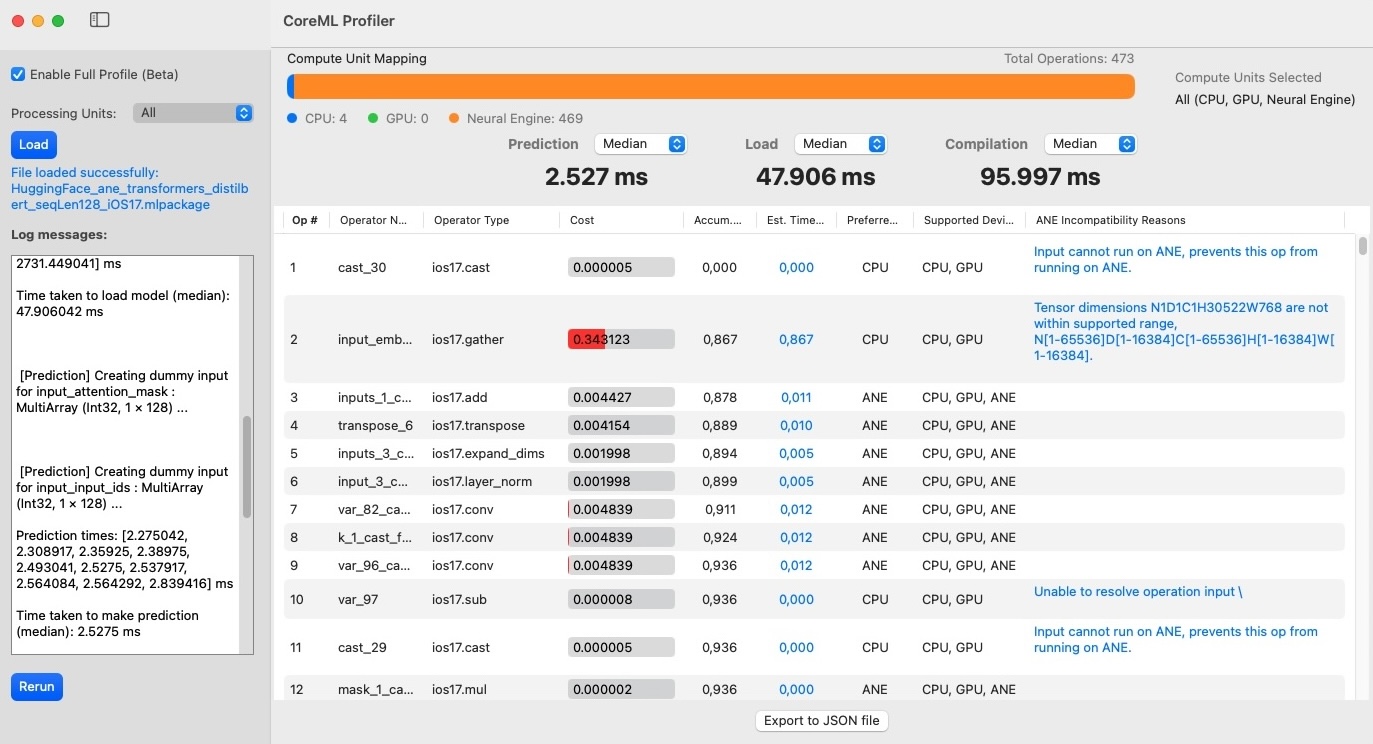
This analysis provides valuable insights into ANE compatibility for each operation in the model.
This analysis provides valuable insights into ANE compatibility for each operation in the model. The complete source code and more detailed information about the CoreMLProfiler tool can be found in the CoreMLProfiler GitHub repository. Below is a screenshot of the Core ML Profiler tool in action:
For more details and information about the CoreMLProfiler tool, please refer to the GitHub repository linked above.
Profiling Core ML Models On-Device in Real-Time
While the CoreMLProfiler tool provides comprehensive profiling capabilities, there are scenarios where you might need to profile Core ML models directly on the device in real-time. The CLIP-Finder project demonstrates how to implement such on-device profiling. Let's examine the ModelProfiler class from the project's CoreMLProfiler.swift file:
class ModelProfiler: ObservableObject {
    static let shared = ModelProfiler()

    private let clipImageModel = CLIPImageModel()
    private let clipTextModel = CLIPTextModel()
    private let processingUnits: [MLComputeUnits] = [.all, .cpuOnly, .cpuAndGPU, .cpuAndNeuralEngine]
    public let processingUnitDescriptions = ["All", "CPU Only", "CPU + GPU", "CPU + ANE"]

    @Published var profileResultsImage: [[Double]] = Array(repeating: Array(repeating: 0, count: 10), count: 4)
    @Published var profileResultsText: [[Double]] = Array(repeating: Array(repeating: 0, count: 10), count: 4)

    // ... (other properties and methods)
}
Let's break down the key components of this class:
- Singleton Instance: The class uses a shared singleton instance, allowing easy access throughout the app.
- Model Instances: It maintains instances of
CLIPImageModelandCLIPTextModelfor profiling. - Processing Units: The class defines an array of
MLComputeUnitsto test different hardware configurations. - Results Storage: Two-dimensional arrays store profiling results for both image and text models across different processing units.
The main profiling logic is implemented in the runProfiler() method:
func runProfiler() async {
    for (index, unit) in processingUnits.enumerated() {
        await profileForUnit(unit, atIndex: index)
        await profileForUnitText(unit, atIndex: index)
    }
}
This method iterates through each processing unit, profiling both the image and text models. The profileForUnit() and profileForUnitText() methods perform the actual profiling:
private func profileForUnit(_ unit: MLComputeUnits, atIndex index: Int) async {
    clipImageModel.setProcessingUnit(unit)
    await clipImageModel.reloadModel()

    // Create dummy input
    guard let dummyInput = createDummyWhitePixelBuffer(width: 256, height: 256) else {
        return
    }

    // Perform inference multiple times and measure performance
    for i in 0..<10 {
        await AsyncProfileModel("CLIP MCI Image Prediction") { done in
            Task {
                if let _ = try await self.clipImageModel.performInference(dummyInput) {
                    done()
                } else {
                    done()
                }
            }
        } storeIn: { time in
            DispatchQueue.main.async {
                self.profileResultsImage[index][i] = time
                PerformanceStats.shared.addClipMCIImagePredictionTime(time)
            }
        }
    }
}
These methods:
- Set the processing unit for the model
- Reload the model with the new configuration
- Create dummy input data
- Perform inference multiple times, measuring the execution time
- Store the results for later analysis
This on-device profiling approach allows for real-time performance analysis across different hardware configurations, providing valuable insights for optimizing model deployment in production applications.
For a more detailed look at the implementation of on-device profiling, please refer to the CoreMLProfiler.swift file in the CLIP-Finder GitHub repository.
The ModelProfiler also allows for comparing performance under different power modes. Below are two screenshots showing profiling results with power saving mode on and off:
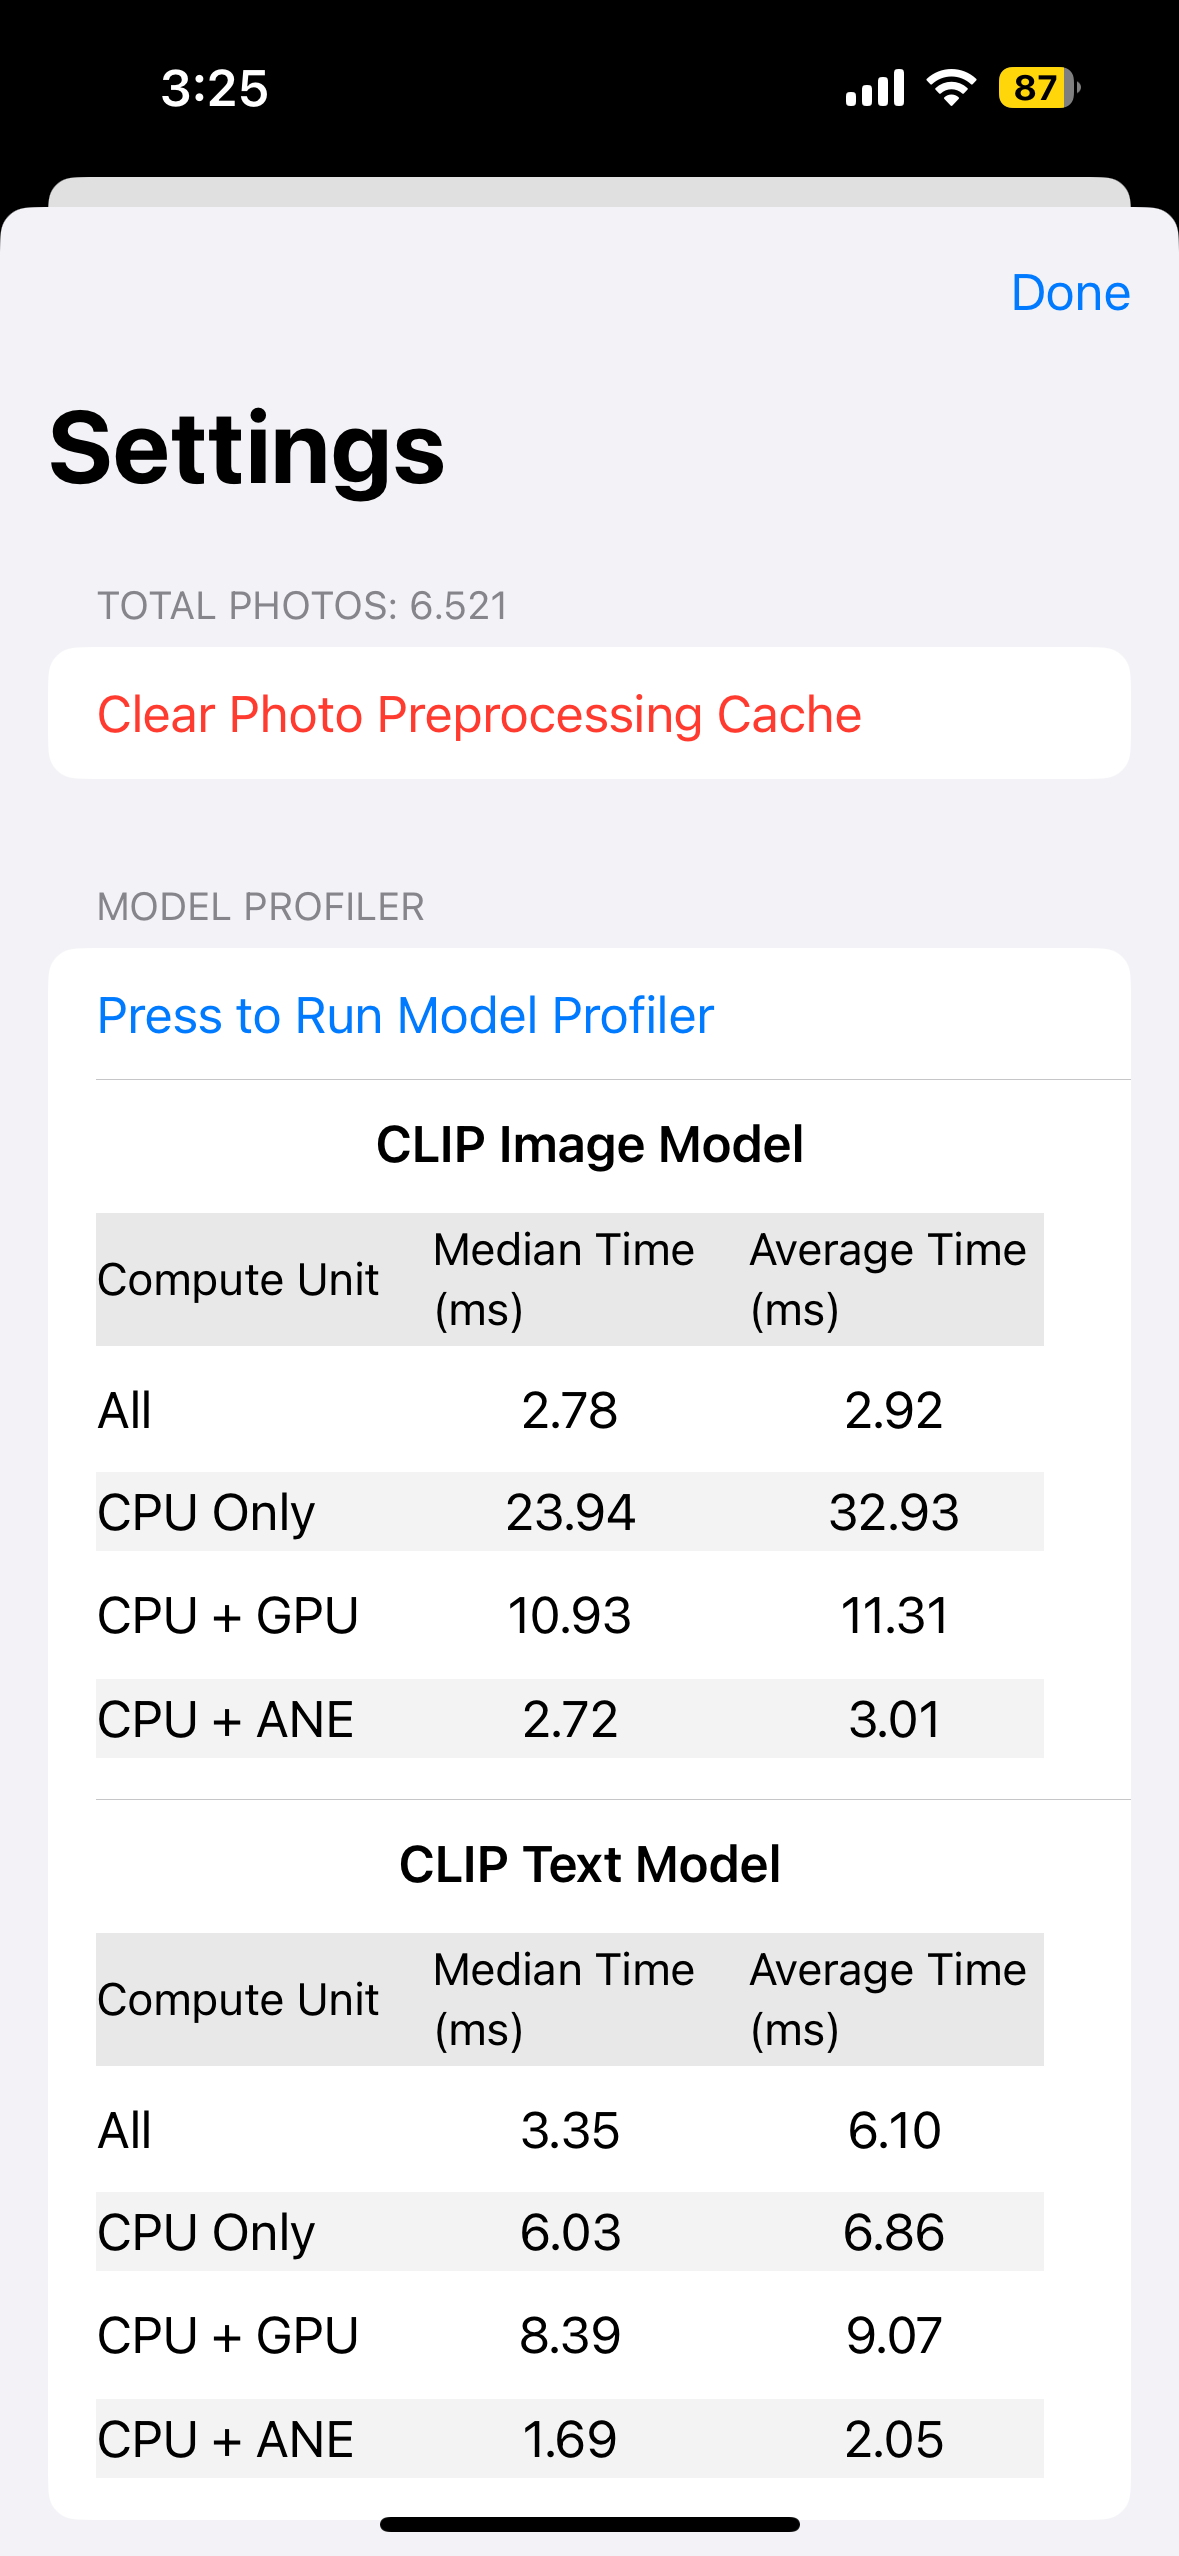
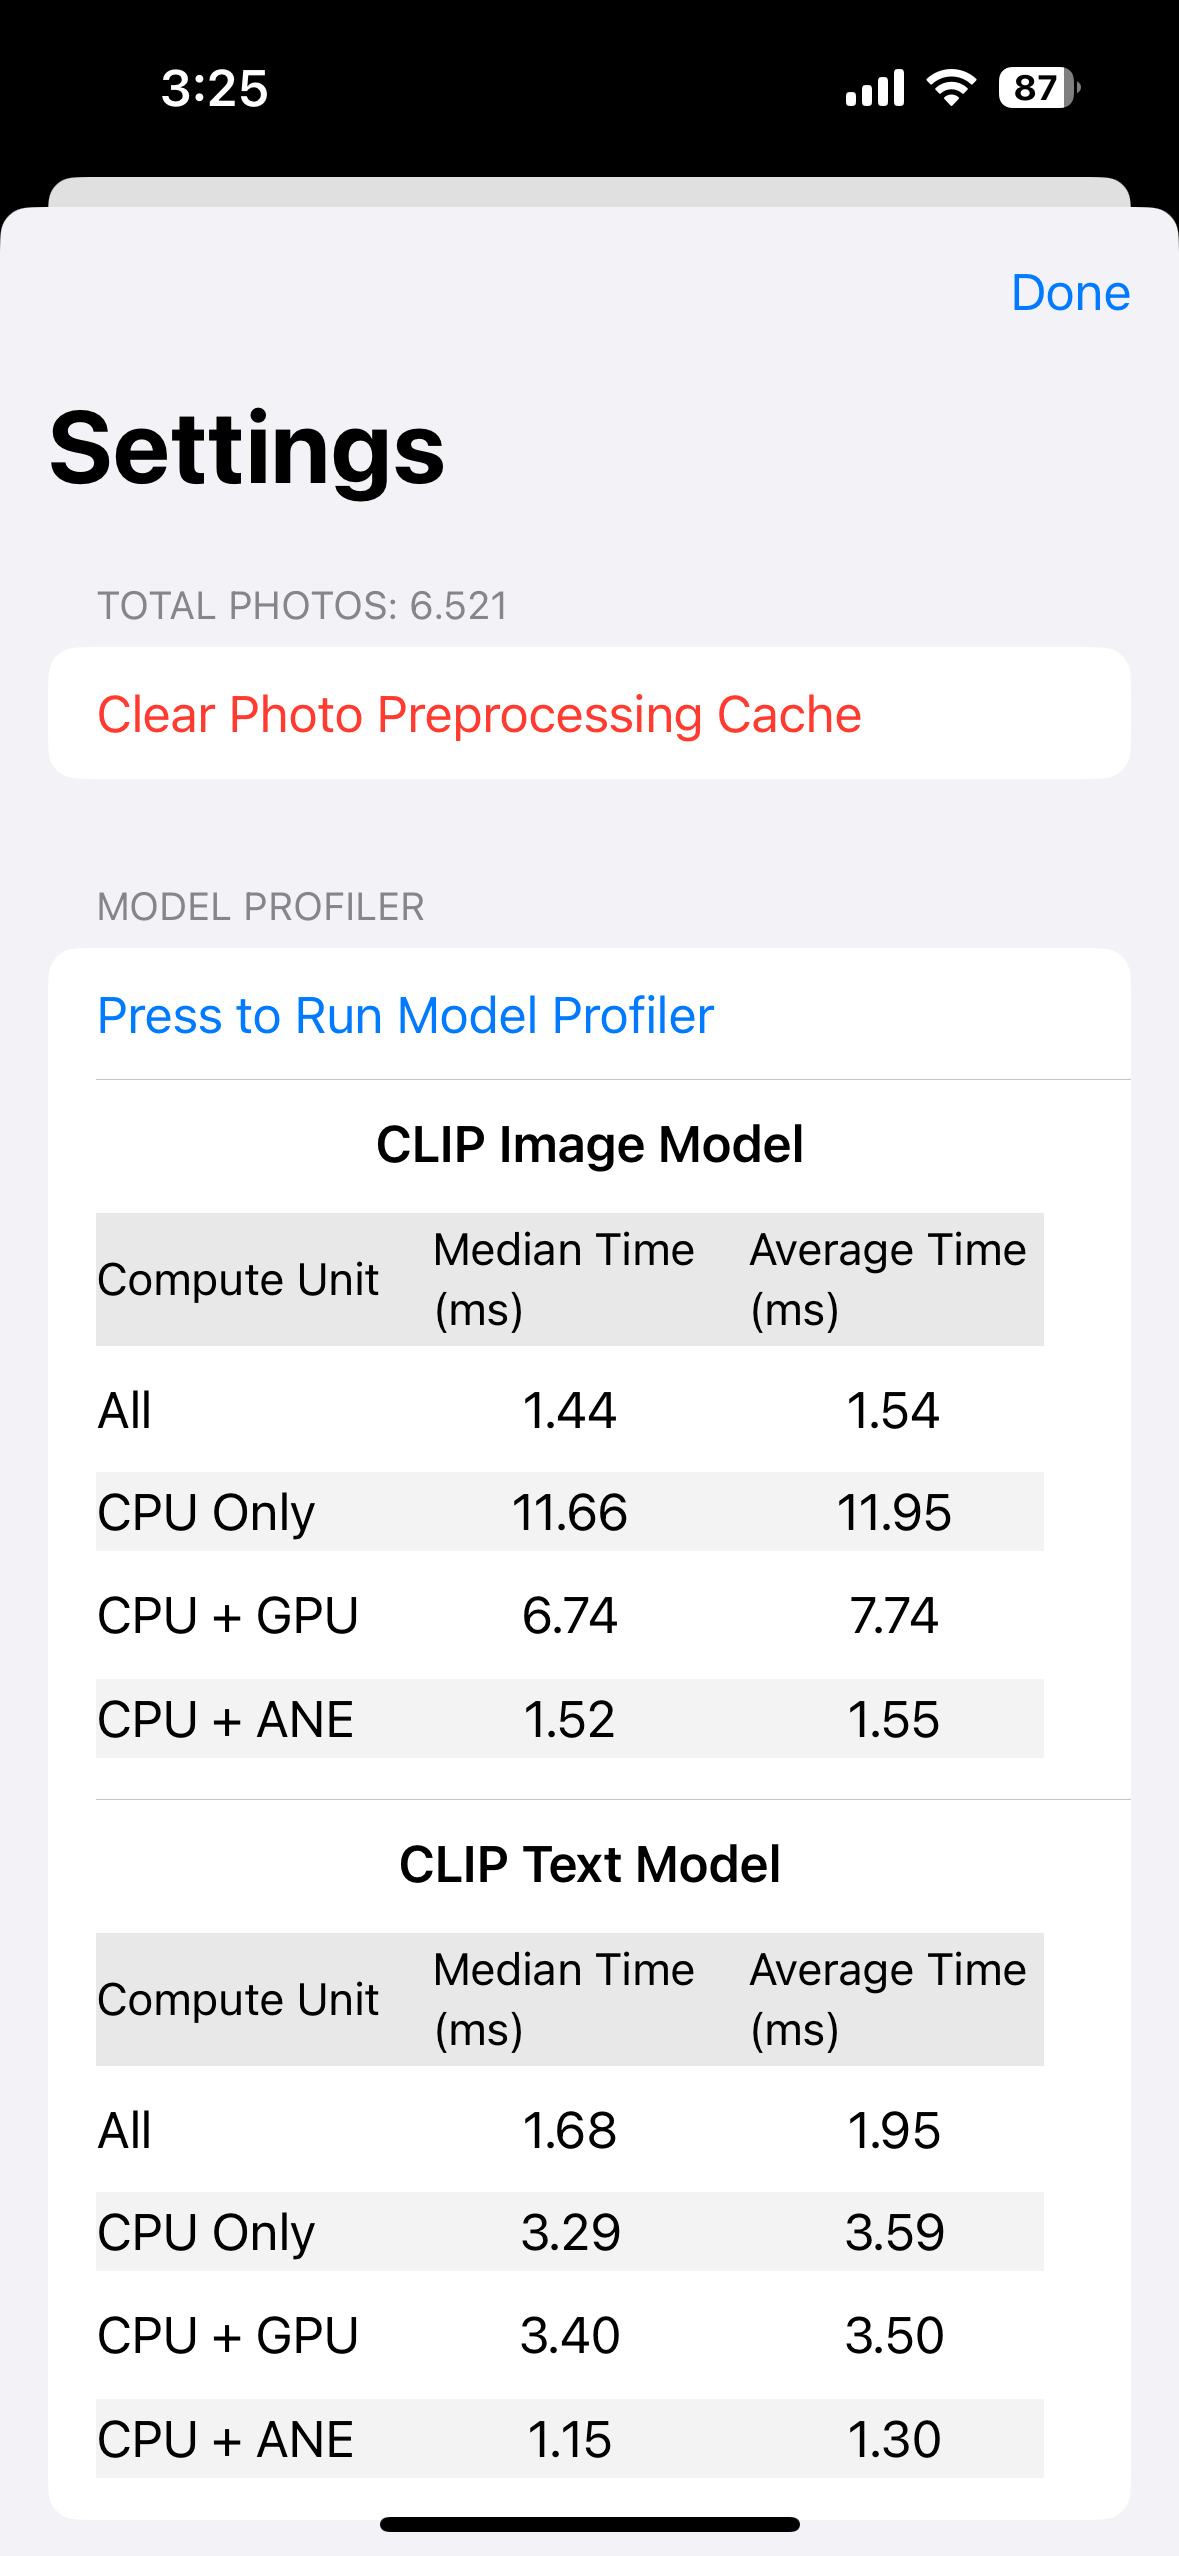
As we can see from these results, the power saving mode significantly impacts the performance of the models, especially when using the CPU. The ANE (Apple Neural Engine) seems less affected, showcasing its efficiency even in power-constrained scenarios. This demonstrates the importance of considering different power modes when optimizing Core ML models for real-world usage.
Profiling Results of the MobileCLIP Model on M1 Architecture
Using the CoreMLProfiler tool, we conducted a comprehensive analysis of the MobileCLIP model on Apple's M1 architecture. MobileCLIP, developed by Apple, is a lightweight version of the CLIP (Contrastive Language-Image Pre-training) model, designed for efficient multimodal learning on mobile devices. For more information about MobileCLIP, you can refer to the MobileCLIP paper and the official GitHub repository.
The profiling results, available on the MobileCLIP Hugging Face page, provide insights into the performance characteristics of different MobileCLIP variants across various compute units. Here's a summary of the results:
| Prediction Times Apple M1 | CPU + ANE | CPU + GPU | CPU Only |
|---|---|---|---|
| clip_image_s0 | 1.4ms | 7.4ms | 12.7ms |
| clip_image_s1 | 2.1ms | 13.3ms | 21.8ms |
| clip_image_s2 | 3.0ms | 19.0ms | 28.5ms |
| clip_image_b | 12.4ms | 36.2ms | 38.1ms |
| clip_text_s0 | 1.1ms | 4.1ms | 4.8ms |
| clip_text_s1 | 2.0ms | 7.1ms | 9.5ms |
| clip_text_s2 | 2.0ms | 7.1ms | 10ms |
| clip_text_b | 2.0ms | 7.2ms | 9.8ms |
These results provide several interesting insights:
- ANE Performance: The Apple Neural Engine (ANE) significantly outperforms both CPU and GPU for all model variants, especially for image models.
- Scaling Efficiency: As the model size increases (from S0 to B), the performance gap between ANE and CPU/GPU widens, highlighting the ANE's efficiency for larger models.
- Text vs. Image Models: Text models generally show less variation across compute units compared to image models, suggesting they might be less compute-intensive or more optimized for CPU execution.
- CPU vs. GPU: For smaller models, CPU performance is comparable to GPU performance, but for larger models (especially image models), GPU starts to show an advantage over CPU-only execution.
These profiling results are crucial for developers looking to optimize their Core ML model deployment strategy. They highlight the importance of leveraging the ANE when available, especially for larger and more complex models.
Conclusions
Profiling Core ML models is an essential step in developing efficient and performant machine learning applications for Apple devices. Through this article, we've explored:
- The design and implementation of a dedicated Core ML profiling tool
- Techniques for on-device, real-time profiling of Core ML models
- Practical profiling results for the MobileCLIP model across different Apple Silicon compute units
Key takeaways include:
- The importance of comprehensive profiling across different compute units (CPU, GPU, ANE)
- The significant performance benefits offered by the Apple Neural Engine, especially for larger models
- The value of custom profiling tools in gaining deeper insights into model performance
- The need for tailored optimization strategies based on model architecture and target hardware
As Apple continues to advance its machine learning hardware and software ecosystem, staying informed about profiling techniques and performance characteristics will be crucial for developers aiming to create cutting-edge AI applications on Apple platforms.